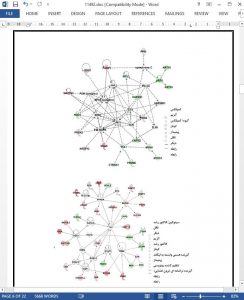
The differentiation potential of pluripotent embryonic stem cells (ESCs) can be manipulated via serum and medium conditions for direct cellular development or to maintain a naïve ground state. The selfrenewal state of ESCs can thus be induced by adding inhibitors of mitogen activated protein kinase (MAPK) and glycogen synthase kinase-3 (Gsk3), known as 2 inhibitors (2i) treatment. We have used a shotgun proteomics approach to investigate differences in protein expressions between 2i- and serum-grown mESCs. The results indicated that 164 proteins were significantly upregulated and 107 proteins downregulated in 2i-grown cells compared to serum. Protein pathways in 2i-grown cells with the highest enrichment were associated with glycolysis and gluconeogenesis. Protein pathways related to organ development were downregulated in 2i-grown cells. In serum-grown ESCs, protein pathways involved in integrin and focal adhesion, and signaling proteins involved in the actin cytoskeleton regulation were enriched. We observed a number of nuclear proteins which were mostly involved in selfrenewal maintenance and were expressed at higher levels in 2i compared to serum - Dnmt1, Map2k1, Parp1, Xpo4, Eif3g, Smarca4/Brg1 and Smarcc1/Baf155. Collectively, the results provided an insight into the key protein pathways used by ESCs in the ground state or metastable conditions through 2i or serum culture medium, respectively.
Western blot analysis
Equal amount of proteins (50μg) from three biological replicates were separated on a 12% SDS-PAGE gel and. The uniformity of the protein amount loaded on the gels was also visulized by staining SDS-PAGE gels using Coomassie Brilliant Blue (Fig. S3). For Western blot analysis, proteins were electrophoretically transferred onto polyvinylidine difluoride membranes (Bio-Rad). The blots were blocked with TBST (20mM tris-HCl, pH 7.6, 150mM NaCl, and 0.1%ween-20), containing 5% BSA, followed by incubation with primary antibody solution overnight at 4 °C. After washing with TBST, the membranes were incubated with horseradish peroxidase (HRP)-conjugated secondary antibody at room temperature for 1h. Signals were detected with ECL substrate (GE) using Hyperfilm (GE). Supplemental Table S3 represents the primary and secondary antibodies used. Gapdh was used as the loading control. Protein bands were quantified by using ImageJ software. The volume of each band was analyzed using student’s t-test.
